Brightness-Band Projection for Residual Silicon Segmentation in C/SiC Composites
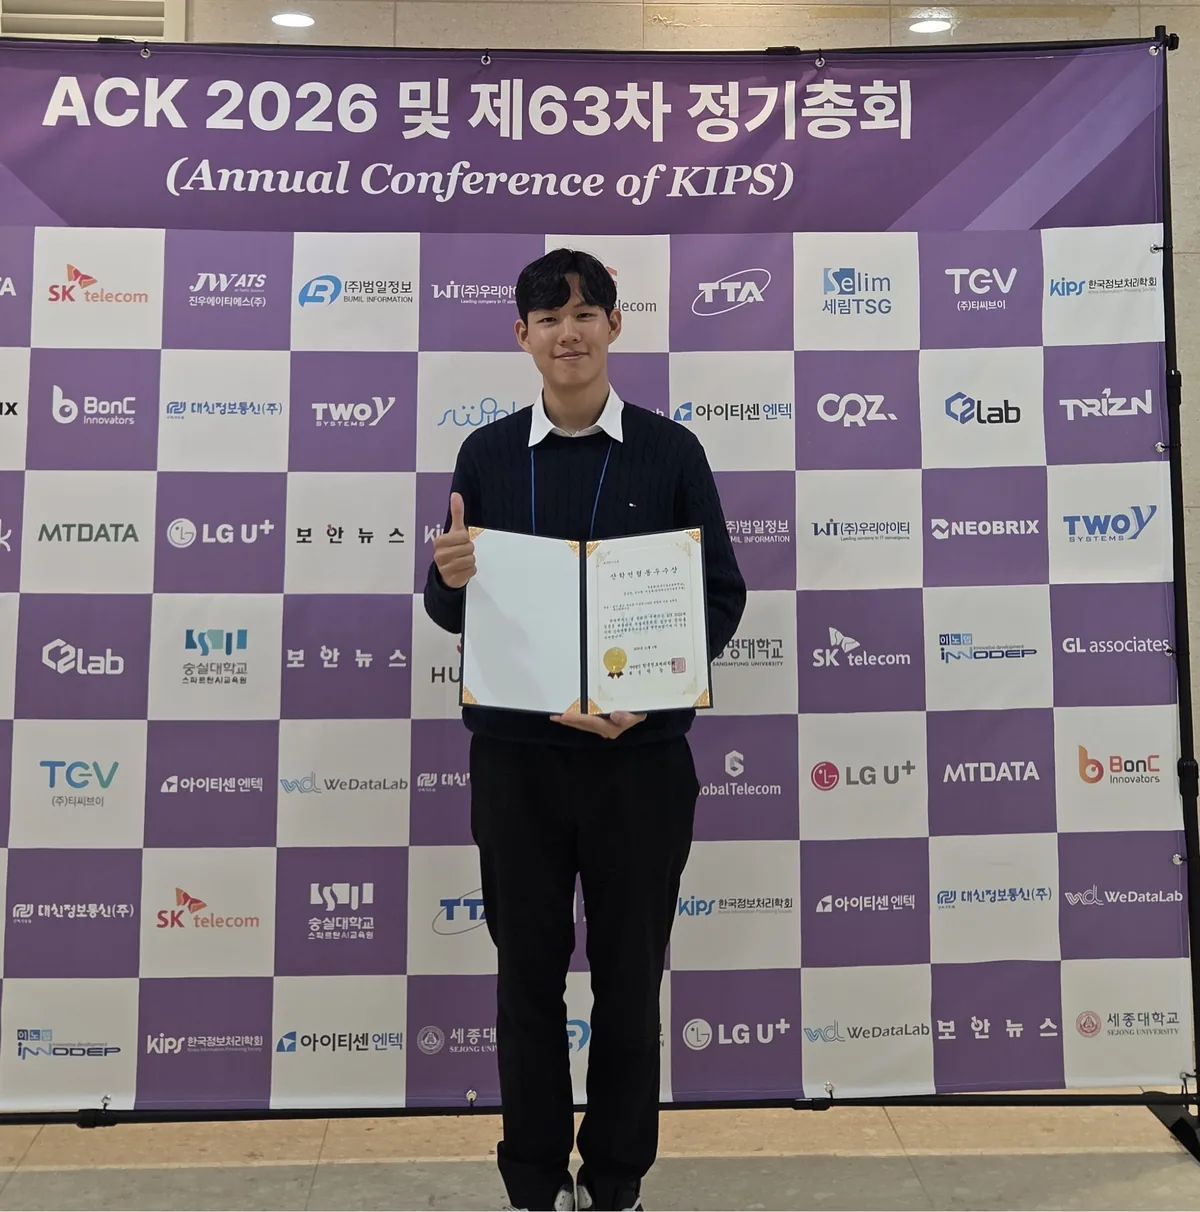
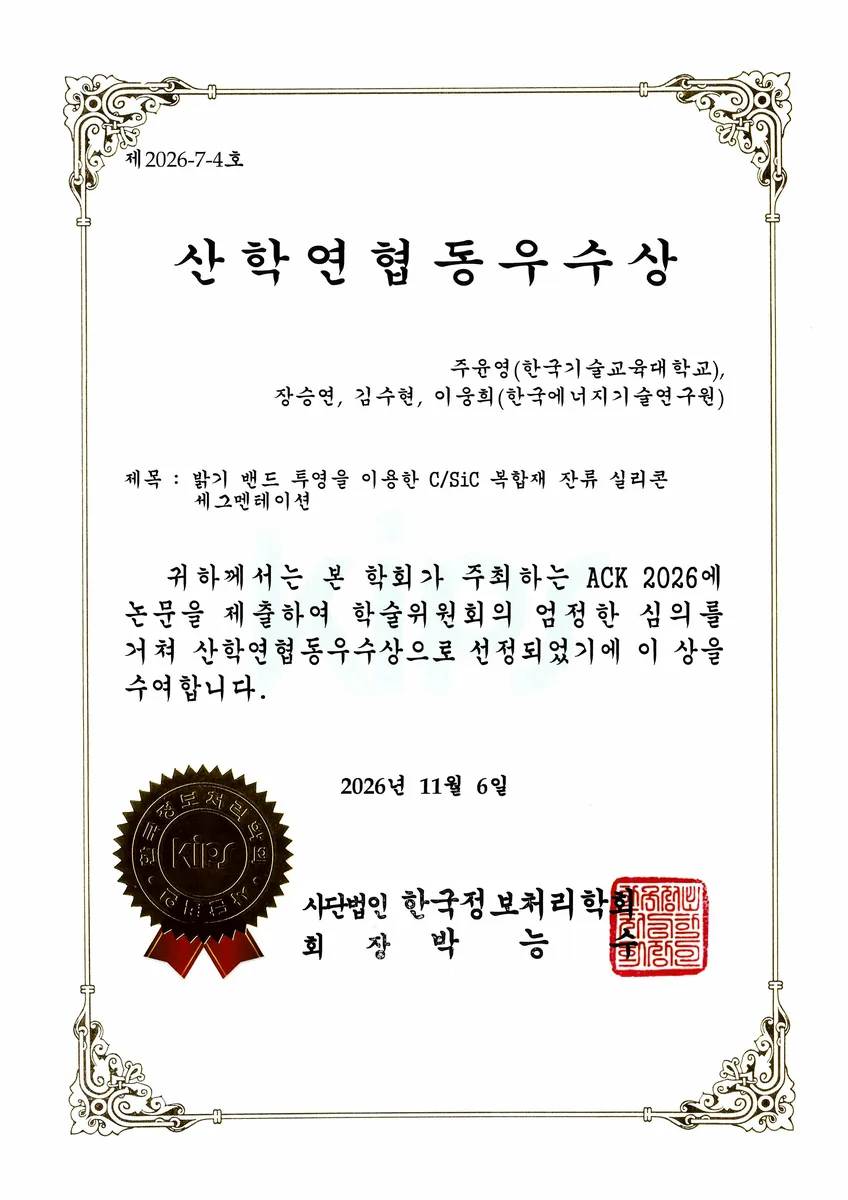
🏆 Industry-Academia-Research Collaboration Excellence Award — ACK 2026 (Annual Conference of the Korea Information Processing Society), November 6, 2026, Sejong University, Seoul. The paper is written in Korean.
Background
C/SiC ceramic composites produced by liquid silicon infiltration (LSI) retain residual Si in the matrix. Residual Si lowers both the maximum service temperature and the mechanical strength, so its volume fraction has to be measured and controlled for each set of process conditions. In practice it is measured as an area fraction on cross-sectional SEM images.
The measurement itself is the bottleneck. An operator picks a brightness threshold per image in a labeling tool and edits the result with a brush; because the brightness distribution differs from image to image, the threshold has to be retuned every time. Throughput and reproducibility both suffer.
Existing methods do not replace this. A threshold chosen automatically (Otsu and the like) differs from the choice an operator would make and cannot express the manual edits. A generic segmentation network, conversely, learns spatial features but does not reflect in its output the fact that the labels were created by a brightness rule in the first place. Even when the network locates the Si correctly, its probability-map boundary is off by pixels from the label boundary, which is a brightness contour.
Method — soft band projection
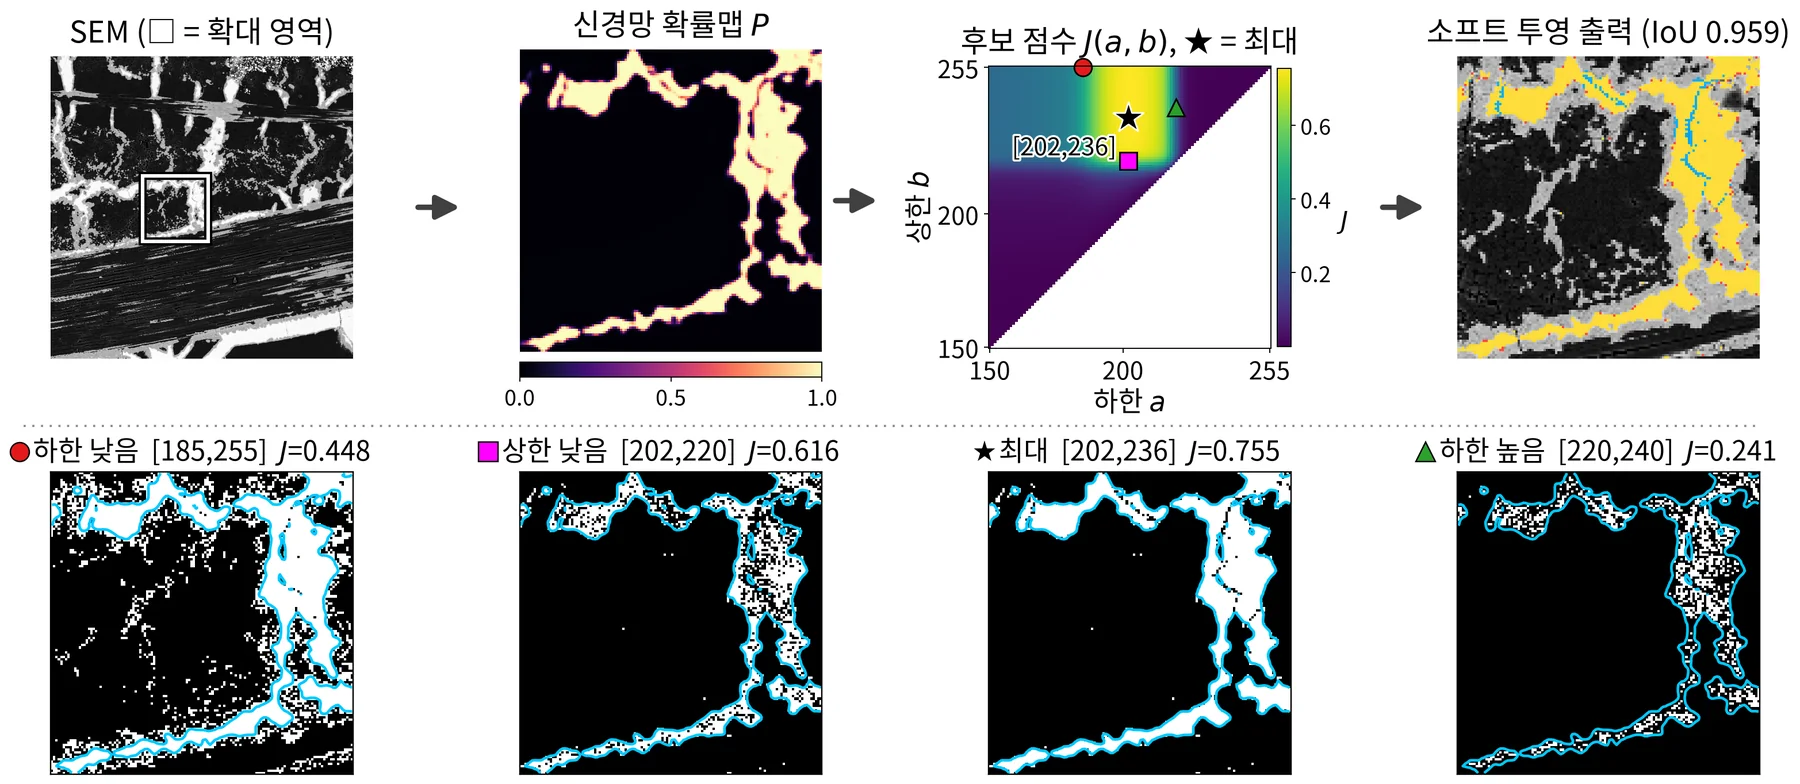
The idea is to put the label-creation rule back in at the last step, where the mask is decided. For each image we pick the brightness interval [a, b] whose mask overlaps most with the shape drawn by the network probability map P, and emit that interval’s mask as the output.
Three components:
- Base segmentation — U-Net++ with an ImageNet-pretrained EfficientNet-B5 encoder. The input is linearly normalized so that the 2nd and 99th percentiles of brightness inside the analysis region map to 0 and 255 (applying one shared threshold to all images gives IoU 0.55 on raw brightness and 0.80 after normalization). The loss is BCE + Dice plus soft-clDice weighted 0.5, which accounts for the connectivity of thin Si structures. Probability maps from five seeds are averaged.
- Band candidates — a lower bound alone would admit every bright pixel above the threshold, so an upper bound is needed: pixels excluded by hand have a median brightness of 251, brighter than the 217 of the Si that was kept. Candidates are all integer pairs 150 ≤ a ≤ b ≤ 255, covering the 178–255 range of thresholds actually used in practice.
- Soft score — binarizing the probability map at 0.5 before measuring overlap wipes out the signal on images where Si is sparse, so candidates are scored by a soft IoU against the un-binarized P.
Results
33 images from six specimens were evaluated with specimen-wise 6-fold cross-validation, holding out one specimen at a time so that no specimen appears in both training and test.
| Method | IoU | Si area-fraction error (%p) |
|---|---|---|
| Otsu (binary) | 0.220 | 33.37 |
| GMM, 8 components | 0.786 | 2.96 |
| Fixed-threshold baseline | 0.804 | 2.87 |
| U-Net++ (base) | 0.793 | 0.94 |
| + single-threshold projection | 0.842 | 0.71 |
| + soft-clDice | 0.861 | 0.65 |
| + band projection & ensemble | 0.870 | 0.55 |
| + soft objective (proposed) | 0.892 | 0.51 |
| oracle-t (single-threshold upper bound, reference) | 0.977 | 0.22 |
- The mean absolute area-fraction error is 2.87 %p for the fixed-threshold baseline and 0.51 %p for the proposed method. The worst-case error is 24.0 %p for the baseline and 1.8 %p for the proposed method, whose median per-image IoU is 0.958.
- Across 40 configurations of classical methods applied without training, the best IoU was 0.786 (8-component GMM), below even the fixed-threshold baseline at 0.804. On a cross-section of three phases — carbon, SiC and Si — five binary thresholding methods also picked up SiC as Si, staying under IoU 0.24.
- Bootstrapping over the six specimens gives 95 % confidence intervals of 0.809–0.951 for mean IoU and 0.33–0.64 %p for mean area-fraction error.
- How far manual edits are reproduced — with an upper bound b, the band ruled out 71.6 % of the 41,395 pixels excluded by hand (0.7 % for the control with b fixed at 255). Conversely, the 76,293 pixels added by hand — dark because of polishing cracks — sit below the lower bound a, so although the probability map calls 50.4 % of them Si, only 19.2 % survive the projection.
Limitations and future work
31 of the 33 images had an area-fraction error of 1.34 %p or less, so the predicted area fraction of a new specimen image falls within ±1.34 %p with about 90 % probability. The three images with low IoU have Si covering only about 1 % of the analysis region, where the small pixel count makes boundary error dominate IoU.
Four follow-ups: (1) a model that restores Si darkened by polishing cracks and therefore dropped by the projection; (2) a detector for foreign particles whose brightness overlaps Si; (3) an explicit expert criterion for the fine segregation between carbon bundles; (4) extending automatic analysis-region estimation with text recognition on the information bar and boundary detection for non-rectangular specimens. Beyond that, we aim to build a system that rapidly produces reference labels reflecting expert review and editing criteria.
Acknowledgments
This work was supported by the National Research Foundation of Korea, funded by the Ministry of Science and ICT, under the Nano & Material Technology Development Program (Establishment of database hub of ultra-high temperature heat-resistant ceramic materials for space launch vehicles based on AI exploration design and full-cycle data management, No. RS-2025-25442774).